Hopes for Office Sector revival as vacancies hit nine-year high
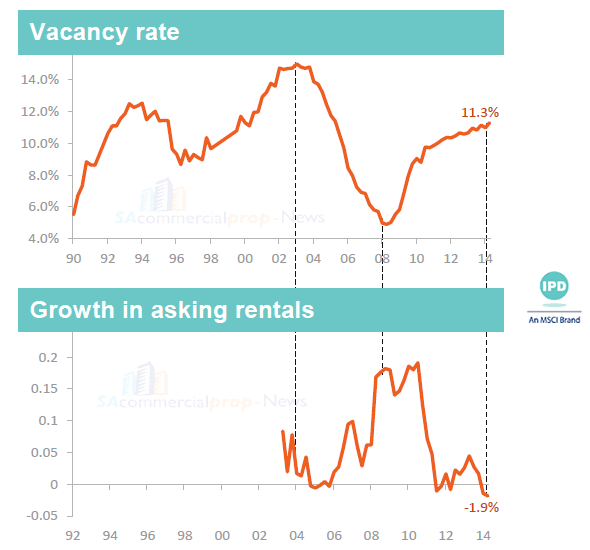
 For the quarter ended June 2014, South Africa's national office property vacancy rate was recorded at 11.3% - up 30bps from the previous quarter.
The corner for South Africa's office market still seems some way away from turning into positive territory, with vacancies in major centres continuing to run at fairly high levels.
This emerges from the just released SAPOA Office Vacancy Survey Q2 results, which now covers 52 distinct office nodes nationally — and its coverage has quadrupled square to 16.8m sqm as at Q2 2014.
IPD South Africa, which compiled the report said for the quarter ended June 2014, the national office vacancy rate was recorded at 11.3% - up 30bps from the previous quarter.
While office vacancies are currently at a 9 year high it is still below the peaks of the previous two cycles (1993 and 2003), the report said.
The office vacancy rate has doubled since mid-2008, when the vacancy cycle bottomed out at 4.9%.

The high and increasing vacancy rate is increasingly weighing on asking rental growth. The average asking rental is currently 1.9% lower than a year ago which is perhaps indicative of the currently tough letting environment where the focus is on tenant retention.
In square meters terms, a net area of 72,591sqm was vacated during Q2 2014. During the quarter, 119,000sqm were let while 192,000sqm was added to the market.
VACANCY RATE BY GRADE
The last quarter saw a continued increase in vacancy at the top end of the market with prime vacancies ending the quarter at 8.5%. There is currently 83,000sqm of unlet prime space – significantly up from 4,000sqm recorded at the end of 2012.
The increase in un-let prime office space has mainly been driven by speculative new developments coming onto market. While the Sandton office node has been responsible for much of the increase in prime vacancy over the period Q2 2013 to Q1 2014, the Cape Town CBD drove the 150bps increase recorded during the latest quarter.
A & B-grade vacancies remain sticky and have been trending sideways since 2011. The A-grade segment ended the quarter at 8.4% while B-grade vacancies continue to stabilize around the 13% mark.
The vacancy rate at the lower end of the market remains high but has started to normalize – albeit off a high base. During the previous cycle, C-grade vacancies were much higher and came down significantly due to conversion of inner city office space to residential.
REGIONAL TREND
On a regional level, the lowest vacancy rate at quarter end was recorded for Pretoria where an all-office vacancy rate of 9.5% was recorded. Although the vacancy rate in the Pretoria region is slightly up from Q1 it down on an annual basis.
On a nodal level, large vacancy increases in Menlyn & Hatfield were largely offset by declines in Highveld Technopark and PTA East. Higher vacancies were also reported in Brooklyn, Silver Lakes, and the Centurion CBD with lower vacancies in PTA East and Sunnyside. On an annual basis, the largest increase was recorded for the Pretoria CBD with smaller increases in Brooklyn and Menlyn.
Cape Town’s office vacancy rate was recorded at 9.7% at year end – only slightly above Pretoria’s 9.5%. During Q2 there were improvements across most nodes which resulted in Cape Town’s regional vacancy rate declining by 50bps. Century City recorded the largest decline in vacancy rate with a 140bp decline to bring vacancies to 5.0% at quarter end.
Johannesburg’s regional vacancy rate continues to be sticky as a whole and has been trending sideways since 2009/10. As at quarter end, the regional vacancy rate was 11.9%. On a nodal level, there were large increases in available space in the Constantia Kloof, Illovo and Morningside nodes. However, this was largely offset by smaller, positive moves in larger nodes like Sandton.
Durban’s regional vacancy rate remains high – but improvements were observed across most nodes. However, Durban still has the highest vacancy rate among the country’s four major metros. The region’s vacancy rate was down on 12 months ago – but still 40bps higher than last quarter. On a nodal level, Berea and Westville recorded higher vacancies compared to the quarter before compared to a slight tick up in Hillcrest and Ballito.
COMPARING INNER CITY & DECENTRALISED RESULTS
As was the case in the previous cycle, inner city office vacancies are significantly higher than that in city decentralized office nodes. In saying that, inner city vacancies are currently lower than it was in 2003 as a result of structural change brought about by the conversion of CBD offices to residential space.
The current level of inner city office vacancies are largely driven by the Durban and Johannesburg CBDs where vacancy rates of 20.5% and 17.7% was recorded at quarter end. The vacancy rate of offices in the inner cities of Cape Town and Pretoria are currently significantly lower at 13.9% and 10.4% respectively.
As at the end of Q2 2014, the vacancy rate of city decentralized office nodes were back in single digits at 9.7%.
DEVELOPMENT ACTIVITY
Development activity remained high at Q2 2014 with ~700,000sqm under development. Expressed as a percentage of existing developments, development activity is currently at 4.0%. While this level is off the highs of 2006-’08 it is high given the level of available space currently available in the market and unlet new developments could weigh on asking rental growth in the short to medium term.
Development activity remains fairly concentrated with a third of office development taking place in Sandton and more than half of development concentrated in 5 nodes.
In what is perhaps a sign of cautiousness among financiers and developers, the development pre-let rate has been trending up since 2008 and is currently at levels last seen in 2003 which was the peak of the previous vacancy cycle. Speculative development peaked in 2008 when only 22% of new developments were pre-let.
OFFICE CYCLE
The office sector can currently be seen as still being in a slowdown phase because of increasing vacancies and slowing rental growth. However, the different office grades find themselves at different phases of the cycle – especially at the top and bottom ends. The slowdown in the prime office segment of the market is driven by un-let new developments entering the marketplace. A & B-grade office vacancy rates have been increasing at a slower rate but haven’t yet showed any signs of turning the corner.
Currently, the total vacancy rate (including un-let new developments) is similar to 2005 levels but development activity is currently significantly higher. This could impact negatively on landlord’s negotiating power, especially seen against a background of lower economic growth when comparing the current macroeconomic environment against that of 2004/’05 when real economic growth was above 5% for 14 straight quarters.
On a nodal level, there is increasing variance in the vacancy rate and level of rental growth of the different nodes which underlines the importance of nodal selection at this point in the property cycle.
ECONOMIC DRIVERS OF THE OFFICE SECTOR
The South African macroeconomic environment continues to face several headwinds and some key catalysts of office sector expansion remain under pressure. Chief among these are the rate of economic growth and specifically that of financial and business services. For the year ending March, real economic growth slowed to 1.6% y/y – largely as a result of the prolonged platinum sector strike. While financial and business services have held up slightly better at 2.0% it is arguably not enough to trigger an upwards shift in employment growth and business confidence.
Business confidence for the quarter ending June came in at 41 (with 50 being neutral) – meaning overall sentiment in the business community is still bearish which doesn’t bode well for short term jobs creation.
Employment growth has been slowing in both the public and private sectors – impacting on the amount of office space needed. Private sector jobs growth was flat over the past quarter while public sector jobs growth of below 1% was recorded.


