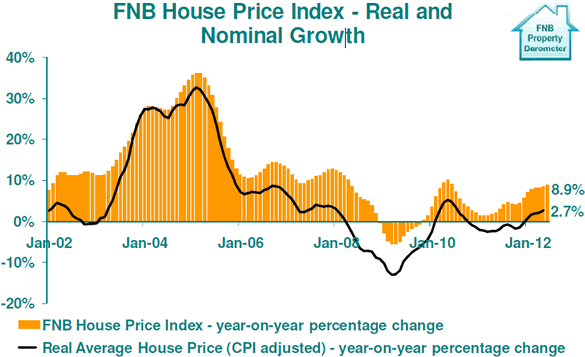
FNB House Price Index rose to 8.9% in June
 Year-on-Year House Price growth accelerated further in June, but month-on-month we are seeing a loss in growth momentum.
The FNB House Price Index showed a further acceleration in June, in year-on-year growth terms, from a revised 8.6% rate in May to 8.9% in June
This is the highest year-on-year growth since June 2010.
In real terms, too, as at May the index showed a mild increase to the tune of +2.7% year-on-year, with consumer price inflation in that month having come in at 5.7%.
This means that since the real “boom-period” house price peak reached in February 2008, real house prices (house prices adjusted for CPI inflation over the period) were -12.6% lower at May 2012, although in nominal terms they were +15% higher than February 2008 as at June 2012. On the other hand, compared to price levels at the inception of the FNB House Price Index back in July 2000, real prices were 70.2% higher as at May 2012, while nominal price were +236.6% higher as at June 2012.

The recent mild resurgence in year-on-year house price growth comes largely as a result of a late-2011 strengthening in the domestic economy after 2 weak Winter quarters in 2011.
However, a better way of examining recent house price growth momentum is on a month-on-month basis, using seasonally-adjusted data. Here, we have begun to see a gradual loss in house price growth momentum since a revised peak in January 2012. From a peak of 1.65% in January, month-on-month seasonally-adjusted house price growth has slowed to 0.82% by June.
This slowing month-on-month growth trend suggests that a peak in the year-on-year house price growth rate should be reached soon. The recent month-on-month house price growth slowing also appears to be reflective of a housing market that is tracking short term fluctuations in the economy, and signs that economic growth in South Africa is slowing.
Already we have seen real economic growth, on a quarter-on-quarter annualized basis slow from a mini-peak of 3.2% in the 4th quarter of 2011 to 2.7% in the 1st quarter of 2012. And plotting the 3-month moving average of the Reserve Bank Leading Business Cycle Indicator’s month-on-month growth against month-on-month growth in house prices, we see the Indicator also having begun to slow in March and April, declining by -0.2% as at April.
The FNB Valuers’ Market Strength Index, a barometer of our valuers’ perceptions of market strength, remained virtually unchanged at 45.93 in June, after a some improvement in the 5 months up to and including May. The 5 months of increase prior to June’s stalling were thus supportive of the recent period of the more solid price growth that we saw through the summer. The improvement in the Market Strength Index (which represents the difference between the valuers’ demand strength rating and their supply strength rating) up until May was the net result of a decline in the Valuers’ Supply Rating as well as a rise in the Demand Strength Rating. However, while FNB’s valuers had perceived the market to have strengthened during the summer of 2011/12, the unchanged June reading of the Market Strength Index suggests that they have also seen the pace of improvement in the market slowing recently.
CONCLUSION
While house price growth on a year-on-year basis accelerated further to 8.9% in June, a loss of month-on-month price growth momentum over the past 5 months suggests that the year-on-year growth peak in the FNB House Price Index is not far off.
Various economic data released in recent months suggest that the housing market is set to head into a “softer patch” again. Economic growth slowed mildly in the 1st quarter of 2012, and various global and domestic data point towards further slowing in the current quarter.
In June, some of the national high frequency data releases also pointed to economic slowing. Real retail sales released for April showed further decline in year-on-year growth to 4.7% on a 3-month moving average basis, from a previous month’s 5.9%. The Manufacturing Purchasing Managers’ Index declined for the 3rd consecutive month in May. StatsSA manufacturing stats for April showed a mere 0.8% year-on-year growth on a 3-month moving average basis, further down from a 1.2% growth rate in the previous month. And Mining production declined year-on-year by a massive -10.6% in April on a 3 month moving average basis.
While economic slowing, globally and locally, looks as if it is becoming reality, resulting in declining inflationary pressure, and indeed the CPI inflation rate declined in May to 5.7% (from 6.1% previous), the Reserve Bank continues to keep interest rates unchanged since late-2010, thus not yet offering any new stimulus.
All considered, therefore, a weakening economic environment, coupled with no new interest rate stimulus (reduction) to date, suggests that the recent slowing trend in month-on-month house price growth will continue in the near term, and that this will soon translate into slowing year-on-year house price growth.


